Pillar guide
Social media reporting for South African agencies — the 2026 guide
How to report social media performance to clients in 2026, why South African agencies need a SA-built tool, and an honest comparison of the four tools you're probably evaluating right now — priced in ZAR, not hidden behind FX.
1. Why SA agencies need a SA-built reporting tool
Most social media reporting tools that get recommended in agency circles — AgencyAnalytics, DashThis, Whatagraph, Metricool — are built in the US, Canada, or Europe. They're priced in USD or EUR. Their support hours are PST or CET. And none of them treat the Protection of Personal Information Act (POPIA) as a first-class concern.
For a South African agency, three real costs follow from that:
- Foreign exchange risk. A USD 79/month tool was R1,200 in 2018, R1,400 in 2021, and R1,500+ today. Multiply by your tool stack and that's real margin lost to FX, every month, with no benefit to you or your client.
- POPIA compliance gap. Under POPIA Section 21, your agency is a Responsible Party for the personal data of your client's users when you handle their social-media analytics. A US-built tool with US-jurisdiction data hosting is a risk you carry, not the tool. SA-built tools that host on infrastructure aligned with POPIA shift that risk.
- Support timezone. A platform issue at 09:00 SAST means waiting until 18:00 SAST for the US team to respond. For a tool that runs your monthly client reports, that lag is non-trivial.
None of this is a moral failure of the US-built tools — they're great products. It's just that they were built for a different market.
2. The state of social media reporting in SA agencies today
Talk to almost any SA agency about how they currently produce monthly social reports and you'll hear a version of this:
- Open Meta Business Suite. Export Page reach, post engagement, video views.
- Open LinkedIn Page Analytics. Export follower growth, post impressions.
- Paste both into a Google Sheet someone built two years ago.
- Build slides with screenshots and text boxes that say “reach was up 12%.”
- Send the deck on Friday. Spend Monday fielding the client's “but did it actually do anything?” question.
The Friday-afternoon scramble eats 4–8 hours per agency, per client, per month. For an agency with 10 clients, that's a full senior person's week — every month — spent on reporting that the client receives, glances at, and never references again.
The deeper problem isn't the time spent. It's that the report doesn't actually answer what the client wants to know. The client doesn't care about reach. They care about whether the marketing they paid for produced customers.
3. What a good agency reporting workflow looks like
The reporting workflow that holds up in 2026 has three properties:
It's automated end to end.
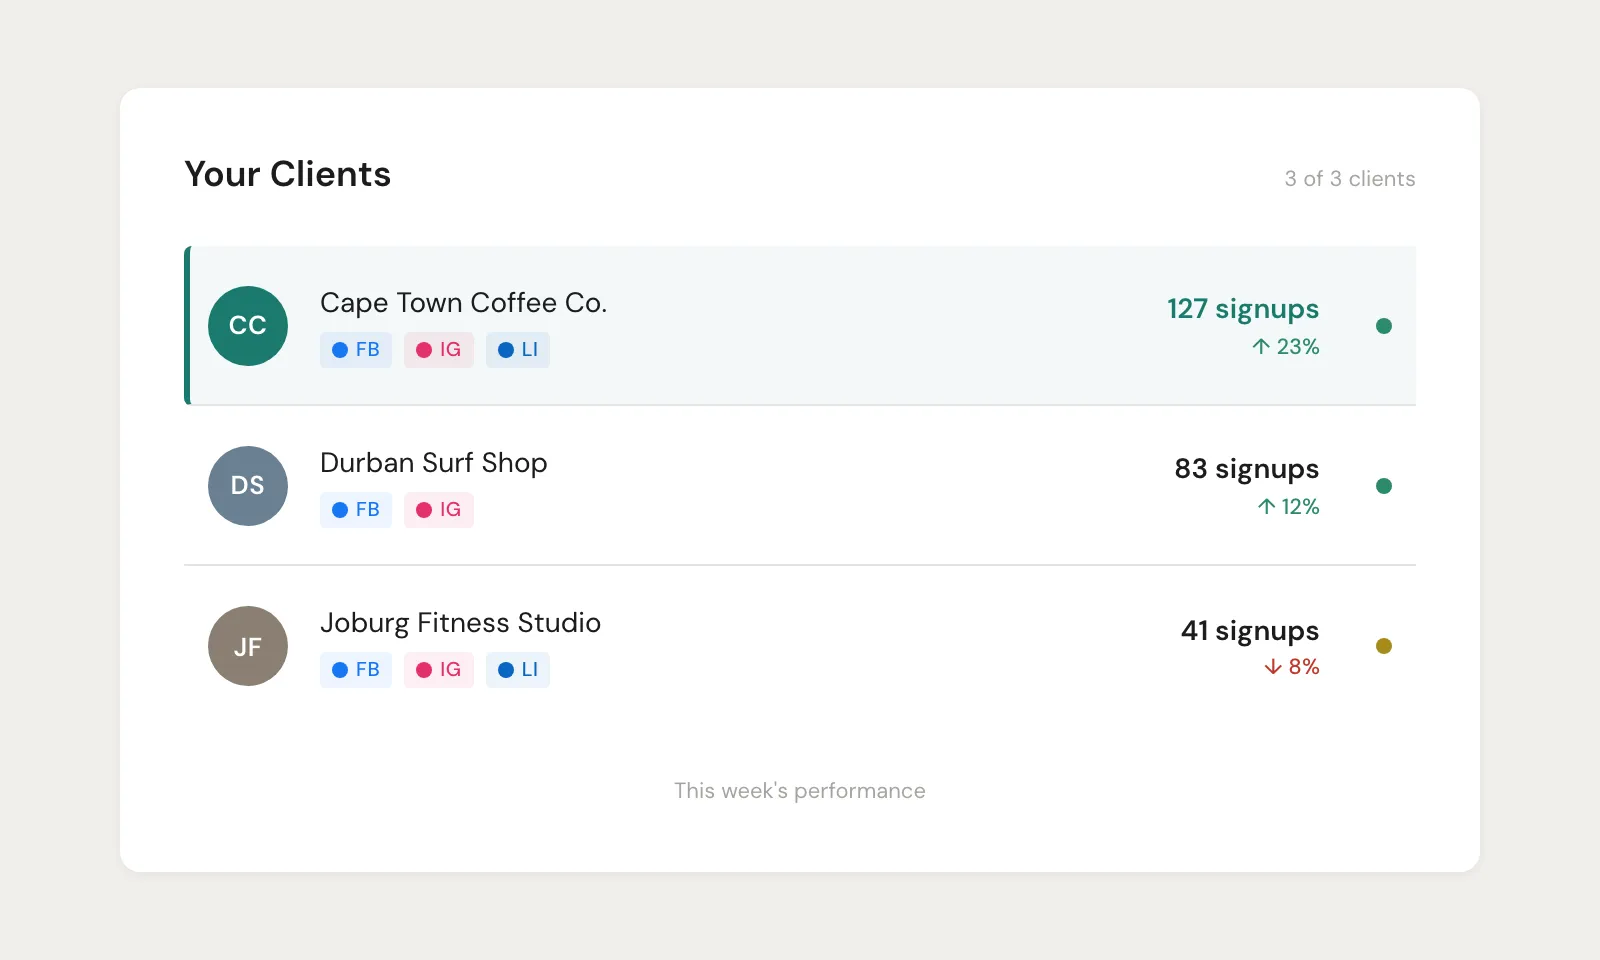
No exporting, no copy-pasting, no slide-deck rebuilds. The data lives in a dashboard the client can log into themselves whenever they want. The agency's job becomes interpretation, not transcription.
It connects content to outcomes.
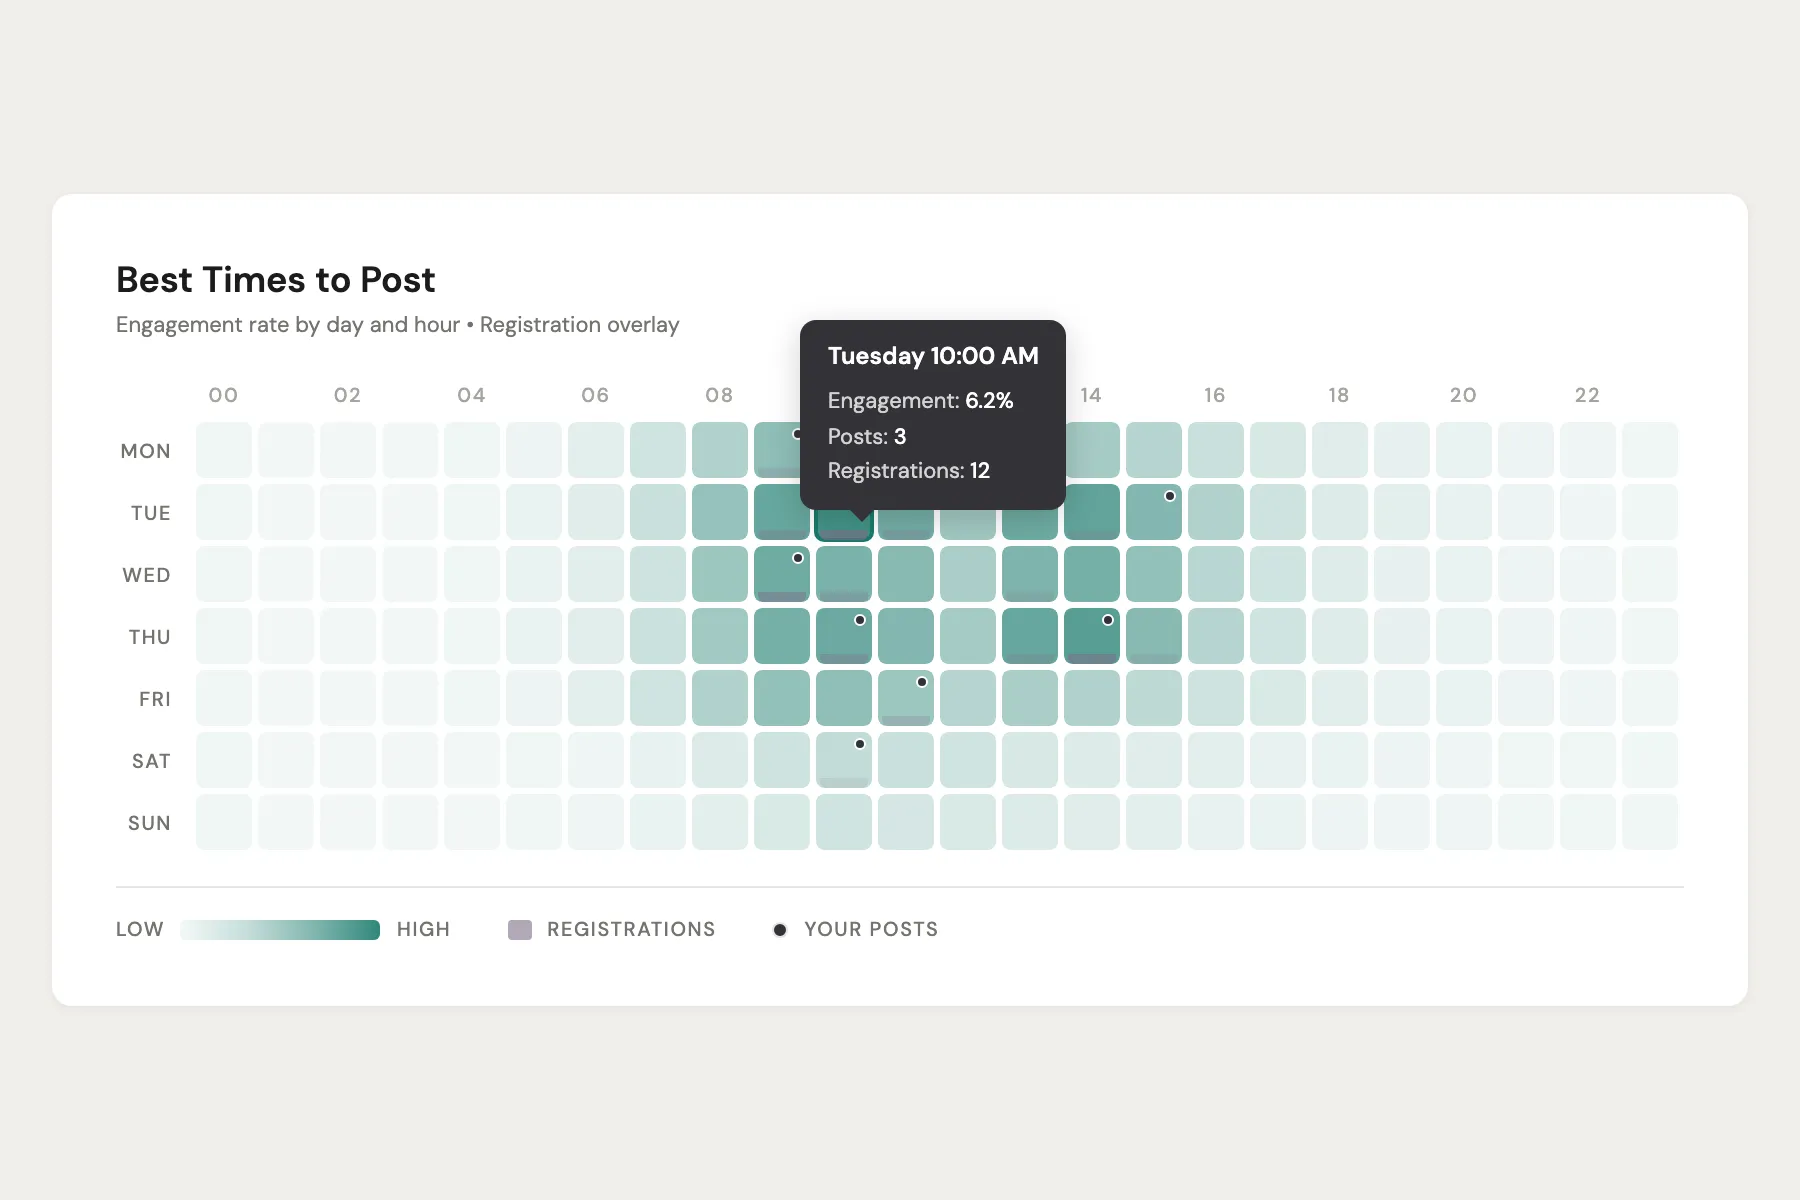
Reach is a vanity metric for everyone except media-buying clients. Most clients want to see the line from “you posted on Tuesday at 10 AM” to “these new customers signed up.” That's the metric the agency should put first, not last.
It's POPIA-aligned by default.
Tokens encrypted at rest. Data residency you can defend in a DPA. Deletion requests honoured within the legislated window. The agency shouldn't be the weakest link in their client's compliance posture.
4. Tool comparison — pricing in ZAR
Indicative monthly pricing for an agency running 10 clients. USD figures converted at R18.50/USD, EUR at R20/EUR (April 2026). Real cost will vary with FX. Kanvro figures are exact.
| Capability | Kanvro Amplify | AgencyAnalytics | DashThis | Whatagraph |
|---|---|---|---|---|
| Monthly cost (10 clients) | R12,000 | ~R5,400 + R370/extra-client overage | ~R5,200 (10 dashboards) | ~R4,400 (entry tier — feature-limited) |
| Pricing currency | ZAR (fixed) | USD | USD | EUR |
| Signup attribution (post → real signups) | Yes — core feature | No | No | No |
| Integrations breadth | FB / IG / LinkedIn / TikTok | 80+ connectors | 35+ connectors | 45+ connectors |
| POPIA stance | First-class — SA-hosted, deletion webhooks, encrypted tokens | GDPR-aligned (US data residency) | GDPR-aligned (Canada-hosted) | GDPR-aligned (EU-hosted) |
| Support timezone | SAST | PST | EST | CET |
| Per-client overage | No — fixed cap per tier | USD 20 per client over cap | ~USD 8 per dashboard over cap | Tier-locked (must upgrade) |
Where Kanvro is genuinely behind: integration breadth. AgencyAnalytics has been around for 10+ years and has 80+ connectors. We have four. If your reporting needs to roll up Google Analytics, Google Ads, Mailchimp, and Stripe alongside social, AgencyAnalytics is currently a better fit. Kanvro is the better fit when signup attribution is the metric your client actually cares about.
5. How Kanvro solves this
Three product decisions that follow from the “built for SA agencies” positioning:
- Signup attribution as core, not an add-on. Every night, Kanvro lines up posts and real registrations side by side. The dashboard leads with the heatmap; reach and engagement live below.
- ZAR pricing, fixed caps. The four tiers (Spark, Ignite, Amplify, Command) are billed in Rands, fixed monthly cost, no per-client overages. See the full pricing page.
- POPIA-aligned by default. Tokens AES-256 at rest, deletion webhooks wired to Meta's data-deletion flow, processed within 30 days. SA-supported, SAST hours.
6. FAQ
- Is Kanvro really POPIA-compliant or just “POPIA-friendly”?
- Compliance is a posture and an ongoing programme, not a checkbox. What Kanvro does: SA infrastructure, AES-256 encryption at rest for tokens, deletion webhooks honoured within 30 days, role-based access control with audit trails, no third-party trackers without consent. Whether your overall agency operation is POPIA-compliant depends on your DPA with the client and what you do with the data. Kanvro removes the tool-side risk; your DPA still matters.
- Can I migrate from AgencyAnalytics or DashThis?
- There's no automatic migration — both tools are closed ecosystems. The practical path: re-connect your client's social accounts to Kanvro (5 minutes per client), let Kanvro backfill (60 days on Ignite, 12 months on Amplify), and run both tools in parallel for a month before cutting over. Most agencies finish the cutover in week 3.
- What if I need Google Ads / Mailchimp / Stripe data too?
- Kanvro is currently social-first. Email hello@kanvro.com with the connectors you need — we're prioritising the next round based on what founding agencies ask for.
- Is signup attribution always reliable?
- It's a temporal correlation, not a clean attribution model — we line up the days you posted with the days signups landed. We don't claim causation, and we explain that to clients in the dashboard. It's the closest thing to a controlled experiment most agencies will ever run on their content calendar, and it's the answer the client actually wants.
Stop reporting on reach. Start reporting on signups.
Spark Free connects one client (your own brand) so you can try signup attribution before onboarding a paying client.